.png)
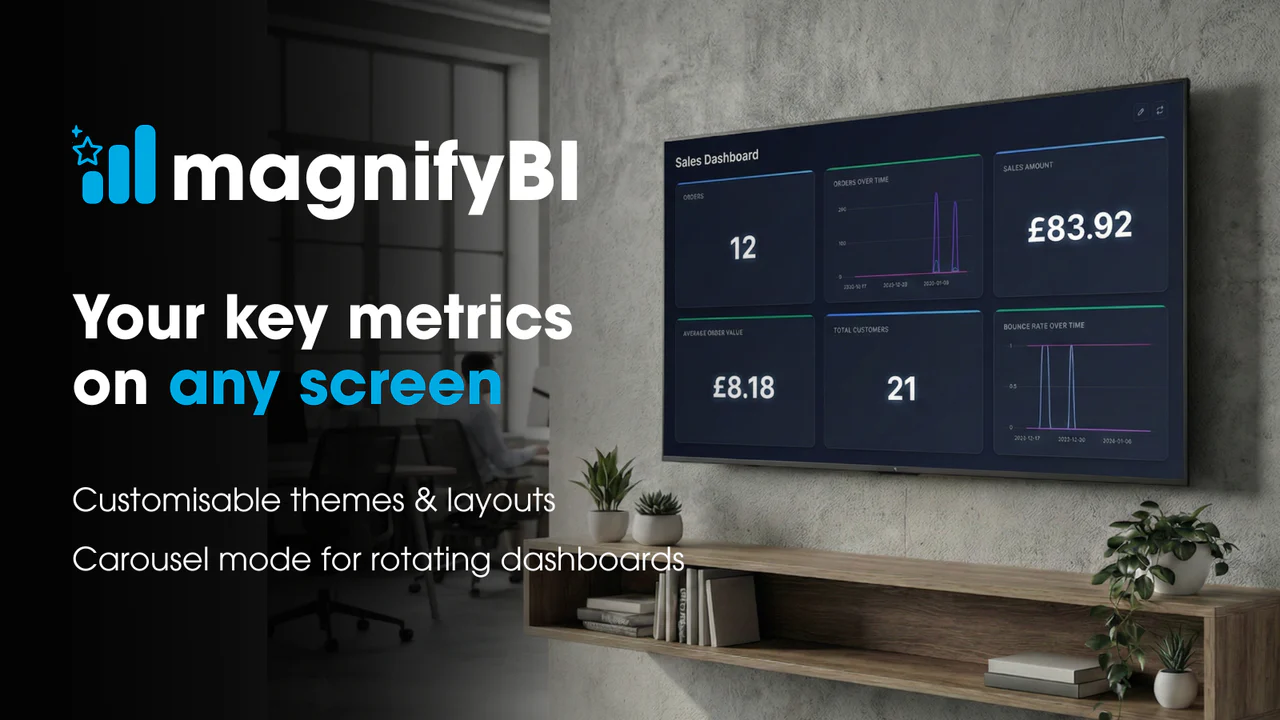
ShopifyQL became interesting for MagnifyBI because the first version of the wallboard problem looked deceptively simple: show merchants their live Shopify performance on a TV-style dashboard. Shopify already has a powerful Analytics area in the admin, and many of the metrics we wanted were already there: sales today, orders over time, top products, average order value, channel mix, and period comparisons. The issue was not whether Shopify could calculate those figures. The issue was access, portability, and presentation. Those insights sit inside the admin experience, behind an admin login, and are not naturally suited to an always-on screen, a rotating wallboard carousel, or a shareable display. That gap is what MagnifyBI was built to fill.
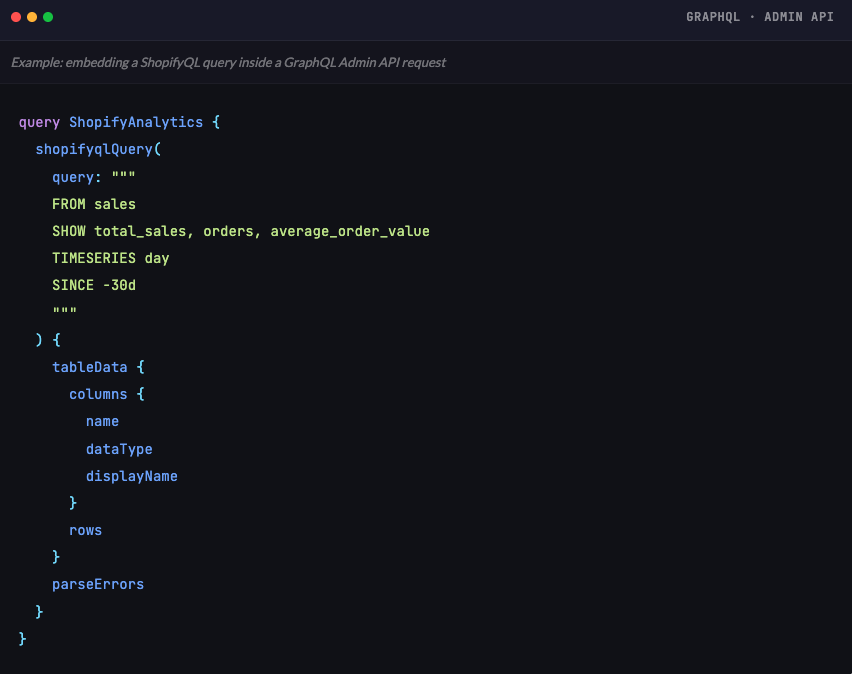
The eureka moment was recognising that many useful wallboard tiles are aggregate analytics questions Shopify already knows how to answer. Rebuilding those numbers from raw Admin API data means pulling orders, line items, refunds, discounts, cancellations, product data, channel data, and date boundaries into an app-owned reporting layer, then trying to reconcile the output against Shopify's own reports. ShopifyQL gives app developers a direct route into Shopify's analytics layer through the GraphQL Admin API: the shopifyqlQuery field executes a ShopifyQL query and returns tabular data, including column metadata, row data, and parse errors. Shopify's own documentation also states that the query string must include FROM and SHOW clauses to define the data source and selected metrics or dimensions. [1]
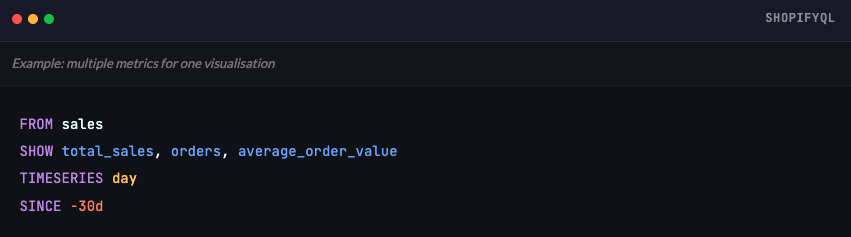
One practical advantage is that a single query can pull back several related metrics for the same time window. For a wallboard, that is useful because the visualisation usually needs to tell one compact story rather than show isolated counters. Sales, order count, and average order value belong together: revenue gives the headline, orders explain volume, and average order value gives useful context about order quality. ShopifyQL's SHOW clause lets those metrics travel together, while Shopify notes that GraphQL Admin API rate limiting for ShopifyQL considers query complexity, including the number of metrics in SHOW and dimensions inGROUP BY [2]
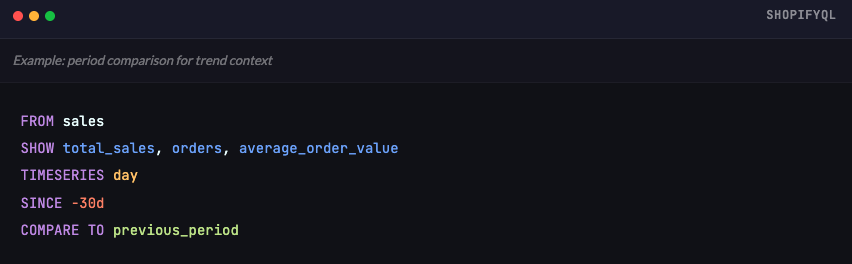
COMPARE TO previous_period is one of the most valuable clauses for wallboard trend analysis. A tile that says "£4,800 today" is useful, but a tile that shows whether today is ahead of, level with, or behind the previous comparable period is much more actionable. Shopify's syntax documentation says COMPARE TO compares the base date range against another date range, and defines previous_period as one period before the base date range. It also notes an important implementation detail: when a query uses a date dimension with COMPARE TO, it must use TIMESERIES rather than GROUP BY [3]
The developer surprise is permissioning. Although the ShopifyQL string is embedded inside a GraphQL query, the GraphQL layer does not appear to permission-check the specific ShopifyQL fields being requested. The current shopifyqlQuery docs require the read_reports scope and Level 2 protected customer data access, including name, address, phone, and email fields.(1). In a Shopify Developer Community thread, a Shopify staff member confirmed that Level 2 customer data access is required even when the query does not specifically ask for customer data, because shopifyqlQuery currently provides access to Analytics broadly and granular scopes are not applied to the individual data domains. [4]
That means even a narrow aggregate query such as sales today can require permissions that feel broader than the returned data.
That creates a real product and review trade-off for app developers. ShopifyQL can avoid a large amount of reporting infrastructure, but it may require an app to request customer-data access that the product does not otherwise need. The concern is not theoretical: developers have raised feature requests asking Shopify for more granular shopifyqlQuery permissions so apps can run aggregated or non-identifying sales and product analytics without requesting Level 2 protected customer data.[5] For MagnifyBI, this makes ShopifyQL a powerful fit for Shopify-native wallboard metrics, but not something to adopt casually. The app needs clear merchant-facing permission messaging, careful app review justification, and a fallback architecture for operational workflows where Admin API data, webhooks, or app-owned storage are more appropriate.
The practical takeaway is to design ShopifyQL around product intent. It is especially strong when the question is an aggregate Shopify commerce question: revenue today, orders this week, sales trend, top products, AOV, and period comparison. It is less suitable when the product needs raw events, arbitrary joins, external ad-spend attribution, support-ticket context, or a long-term independent warehouse. For a wallboard app, that trade-off is attractive: spend less effort recreating calculations Shopify already performs, and spend more effort on the experience merchants actually see — layout, theming, rotations, public links, comparison states, and screens people can understand at a glance.
If you’d like to find out more about how our digital transformation, staff mobile and kiosk apps can transform your online shop, please get in touch for a no obligation chat via info@itsoneiota.com.